
Aircraft-Pilot Coupling – Understanding why and how it happens.
- Andreas
- Jan 19, 2021
- 12 min read

The topic of Aircraft-Pilot Coupling (APC) has historically been referred to as “pilot-induced oscillation” or “pilot-involved oscillation” (PIO). In more recent documents, the industry adopted the term APC, mainly to cover all applicable situations, as the interaction is not always induced by the pilot and it is not necessarily an oscillation [1]. PIO is still being used for a specific subset of APC (see Figure 2). The US National Research Council refers to APC as “less-than-ideal interactions between pilots and aircraft” [1].

One of the most important aspects of APC is to realize that these events are not limited to flight tests of new aircraft or “beginner pilots” trying to land. Undesired aircraft-pilot interactions can happen to all pilots, no matter how experienced they might be. One of the main reasons being that a human pilot is of a slow-adaptive nature and can progress well into an APC event before realizing it [2] [3]. It is up to the aircraft manufacturer to make such an occurrence very unlikely, but history has taught us that starting from the Wright Flyer to the latest fighter aircraft, APC events have occurred and continue to occur world-wide [1]. Outside the flight test world, most common reasons for APC are inadvertent actions by the crew, turbulence-induced upsets and system malfunctions.
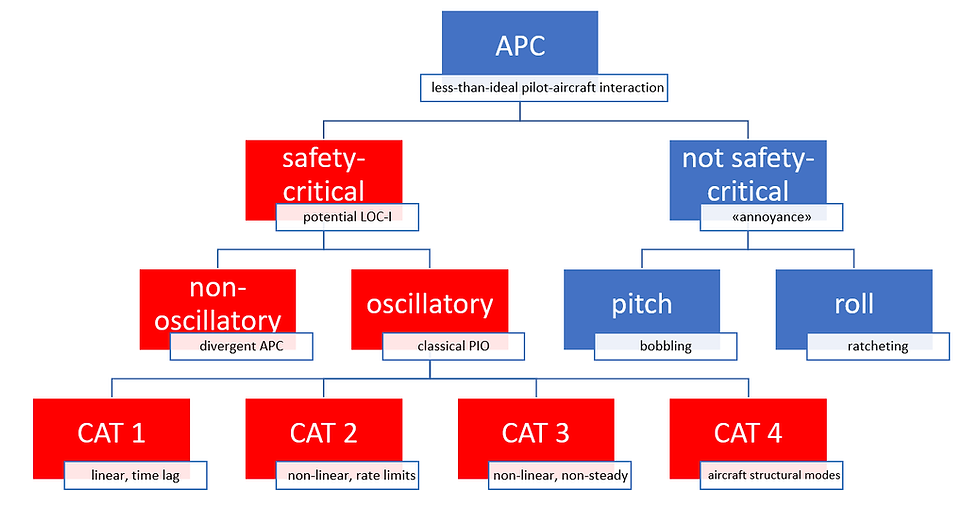
APC categories
Over the years, different categories of APC have been established [2][4][8]:
Category 1: Linear deficiencies caused by excessive time delays or improper stick sensitivity.
Category 2: Non-linear effects caused by actuator limits in position or rate.
Category 3: Highly non-linear and non-stationary effects due to transitions in vehicle dynamics, control laws or piloting behavior.
Category 4: Has been introduced recently, referring to the involuntary interaction between the pilot and the aircraft structural modes.
In early conventional airplanes without powered actuators most APC events were caused by poor design of the basic airplane (poor short-period damping, very low stick-forces), so mainly category 1 APC’s. With the introduction of powered actuators, the topic of rate limits became omni-present and remains until today and not surprisingly category 2 and 3 APC’s are of greater interest in recent research [5]. The crash of the B525 helicopter prototype in 2016 would be an example of a category 4 APC event, where the “scissors-mode” of the main rotor was fed back via the pilot’s seat accelerations and collective control, causing a divergent oscillation and loss of control [9].
At the end of the day, it does not matter for a pilot what category of APC he or she is experiencing, the POINT IS TO STOP IT. The pilot has best chances to stop an APC by simply exiting the control loop (let go the inceptor) or by “freezing” the inceptor position. Another option would be to significantly reduce the “gain” (how aggressive the pilot acts on the inceptor), but this has been demonstrated to be very difficult to do [1].
The challenge of flight control
Flight control systems (FCS) form an interdisciplinary field and a tremendous amount of knowledge is required to design a good flight control system. The domain of control system theory is vast and can be mathematically quite involved. The article "C* - An unknown star" provides a description of a typical flight control law used in transport category aircraft.
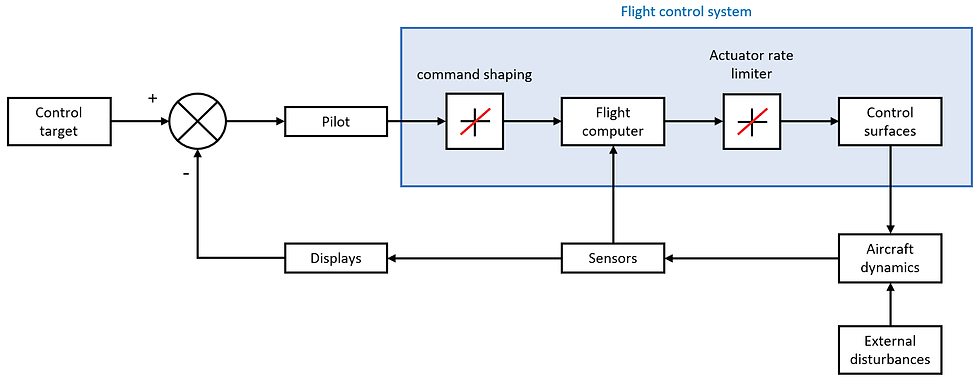
The key aspect is to see the pilot as part of a larger control loop as depicted in Figure 3 below. Usually, there is a control target (e.g., track the localizer) and the pilot receives information about the current deviation value from some form of display. He then mentally builds the “error signal” and forwards the required correction to the FCS. Depending on the flight control law, the flight control computers then calculate actuator commands, which are sent to the control surfaces. Even a “conventional”, non-FBW aircraft typically might have a yaw-damper, which can be seen as a flight computer in this context. The aircraft then reacts to the control surface deflections and these effects are detected by onboard sensors. The FCS receives this feedback directly and the pilot via the displays. It is this “loop” that is of greatest interest when investigation control systems. In particular, how much phase-shift (time delay) occurs between input and output and how much gain is applied by the pilot (how aggressive the pilots acts). The devices that pilots use to control the aircraft are often summarized as “inceptors”.
As described above, the causes for APC events are numerous and we shall therefore only look at some Illustrative examples in this article. One of them is actuator rate limits. It is a primary contributing factor in category 2 APC. It is obvious, that any kind of actuator cannot move a control surface indefinitely fast [3]. The question is: How fast is “fast enough”? There is no general answer to this question and the requirements certainly depend on the type of aircraft and kind of operation. To put numbers in perspective, let us do some simple math: A typically accepted time to reach full deflection on a moderately maneuverable aircraft would be around 0.2 s. If the control surface (e.g., aileron) has a deflection range of +/- 20°, this will require an actuator with a deflection rate of 100 °/s [3]. A real-world example with more stringent requirements: The English Electric Lightning aircraft had an aileron deflection range of +/- 8° (gear up) and the actuators had a rate limit of 160 °/s (!) [3].
Sidenote: A current problem when investigating APC events on civil aircraft is the relatively low sample rate (a couple Hz at best) of flight data recorders [6]. When looking at the actuator rates above it becomes obvious that this is insufficient to properly analyze APC.
A further complication in the case of hydraulic actuators is that the fluid demand to achieve such high rates is quite significant. This is usually accounted for by installing hydraulic accumulators to cover transient demands. This makes it apparent that the system will require some “relaxation time” for the pump to re-establish pressure and cannot maintain such high actuation rates non-stop [3].
So, what happens when the rate limit is reached?
That in itself does not immediately lead to an upset [5]. However, the increased potential for such an event will become obvious when we look at the command signal that is sent to the actuators:
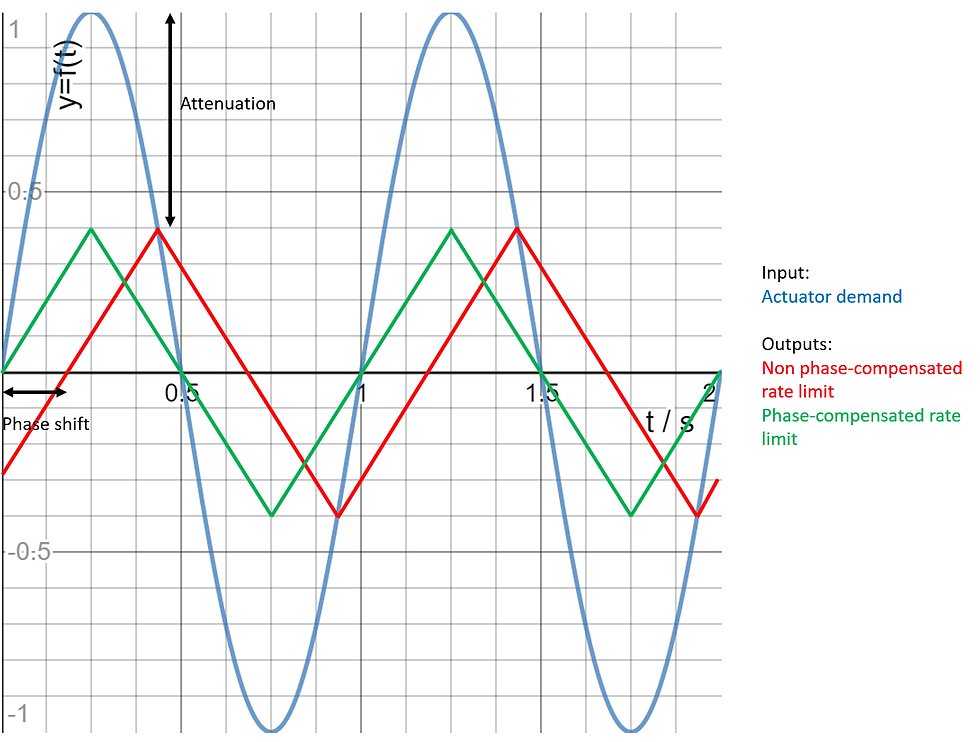
Imagine, that the actuator demand would be the sine wave depicted in blue above. If the signal would be sent to an actuator that cannot keep up with the required deflection rate, we would see the result as depicted by the red line [7] [8]. It is immediately obvious that the red line compared to the blue has a significant phase-shift and attenuation. The phase-shift is perceived by the pilot as a time-delay and makes the aircraft appear “sluggish”. This phenomenon has led to several APC accidents, as it is very easy for a pilot to “overcontrol” in such a situation [8]. On a more technical note, the phase-shift obviously erodes the phase-margin of the control system (see next paragraph). To remedy that phase-shift problem, a special kind of rate limiter has been developed during the 1990’s. The so-called phase-compensated rate limiter [8]. Its output is depicted green in Figure 4. While there is still an attenuation compared to the blue input, there is no longer a phase-shift. This is crucial in preventing APC events. Many modern FCS incorporate phase-compensating rate limiters [8].
How to predict category 2 APC susceptibility
This paragraph is presented for readers interested in control system theory. It is less relevant from an operational perspective. Thus, if you are not particularly into control system theory, feel free to jump to “real-world examples”.
After several accidents related to actuator limits in the 1990’s, a significant effort was made world-wide to better understand the underlying effects. At the German Aerospace Center (DLR) a new method to predict category 2 APC was developed by Duda [7]. The criterion is called Open-Loop-Onset-Point (OLOP) and is best understood in connection with a Nichols chart. The original idea was to predict susceptibility for category 2 APC due to non-phase-compensated rate limitations of actuators [7]. Later, this OLOP criterion was modified to also account for phase-compensated rate limiters which are found in many modern FCS [8].

The idea behind the OLOP criterion is ingenious: The open loop system is analyzed in the frequency domain (blue line in Figure 5). Frequency (ω) is plotted along the blue line from top right to bottom left. As there is a rate limit present, there will be a frequency, where the output starts to shift in phase and gain, for reasons depicted in Figure 4. This is called the onset frequency “ω onset” or Open-Loop-Onset-Point (OLOP) [7]. In a Nichols chart (Figure 5), we can see the phase and gain shift as a “jolt” (red and green arrow). Note that the red arrow represents a non-phase-compensating rate limiter, while the green arrow shows a phase-compensating one. And here is the trick: Depending on “where” in the Nichols chart the OLOP lies, we can see different consequences on the closed-loop gain (curved contours). The original OLOP criterion involved a “boundary”, depicted by the dashed amber line. Later, the OLOP criterion was modified to also account for phase-compensating rate limiters [8]. The red and green regions in Figure 5 aim to convey that. The red area is the “danger-zone”, as there will be a significant closed-loop gain increase caused by the rate limiter. Note the direction of the red arrow: It lies almost orthogonal to the closed-loop contours. This can lead to closed-loop instability [7]. If the same “jolt” would happen in the green region, the direction of the red arrow would be more and more parallel to the closed-loop contours and therefore cause less change in closed-loop gain. This method was successfully used to predict category 2 APC susceptibility for example on the YF-16 or F-18 aircraft [7].
It is also readily apparent, how much more resilient a system is, when it involves phase-compensating rate limiters (green arrow).
Real-world examples
After all that theory we shall look at some examples that occurred in the past. These are examples of events that happened during normal revenue flights without the crew anticipating APC.
Inadvertent crew-action, based on [11]
In 1993, during cruise-flight at FL330, the crew of China Eastern Flight 583 Shanghai-Los Angeles, inadvertently deployed the slats. Apparently, a flight crew member of the MD-11 touched the slat/flap lever without realizing it. The aircraft experienced buffeting, flow separation in the outboard wing region, which caused a pitch-up. The crew then tried to “recover” from the upset and applied pitch inputs on the yoke, initially with the autopilot engaged. Once the autopilot was disengaged, a jolt was felt and a sequence of pitch oscillations was started during which the aircraft lost about 5000 ft of altitude, causing injuries to 156 passengers and crew and two fatalities. The aircraft then made an emergency landing at a nearby air force base. The oscillations were caused by excessive crew inputs on the yoke (up to 50% deflection in the pitch axis). Apart from an “unfavorable” design of the slat/flap handle, the aircraft was found to be airworthy.
From an APC-perspective two aspects are worth highlighting:
- The MD-11 employed “relaxed stability” in cruise and was equipped with a Longitudinal Stability Augmentation System (LSAS), that was essentially a pitch-hold, when the pilot released the yoke. When a certain threshold force on the yoke was exceeded, the LSAS would disengage and let the pilot change the attitude, before re-engaging when the stick-force was released again.
- A time delay of 1 s was intentionally incorporated in the stall warning system in an effort to prevent secondary stalls (the stall warning would sound 1 s longer than the stall condition existed). Investigators believe that this time delay was a significant contributing factor in the development of the oscillation.
System-malfunction, based on [12]
In 2010, a Bombardier Challenger 300 aircraft experienced a pitch-upset in the Moscow terminal area after departure, causing injuries to passengers. An emergency return to the departure airport was carried out after the upset. Here is what happened: After a hasty departure including a runway change, the crew took off without a proper briefing and with insufficient mode awareness. The guidance mode was inadequate, and the heading bug misplaced. The pilot flying was a junior copilot in his “familiarization” phase. After some problems in directional control, the training captain took over control and engaged the autopilot. A transient system malfunction occurred, such that the horizontal stabilizer did not trim the aircraft when commanded by the autopilot. Consequently, the crew received the following cautions: “AP STAB TRIM FAIL” and “AP HOLDING NOSE DOWN”. After further climb and acceleration the crew switched OFF the fasten seatbelt sign and began to work on the malfunction using the QRH. During the procedure, the captain disengaged the autopilot while holding the yoke firmly. Nevertheless, he was surprised by the initial movement of the yoke and the subsequently very light control forces. This led to overcontrolling and three subsequent pitch oscillations involving load factors of +3.6 g and -1.7 g.
Crucial: On the Challenger 300 aircraft, the artificial feel system responsible for generation of the stick forces is controlled by the stabilizer position, NOT the actual airspeed. (I.e.: If the stabilizer is set to a “low airspeed” (high AOA) setting, stick-forces are low, when set to “high-airspeed” (low AOA), stick-forces are high. Consequently, when a malfunction occurs, the aircraft might not generate appropriate stick forces. The crew found themselves at high speed with the artificial feel system being “stuck” in the low-speed setting.
A very similar malfunction has led to an accident involving a Falcon 900. The artificial feel system was also in the low-speed setting while the aircraft was cruising at high speed. Similarly, passengers were not wearing their seatbelts and the crew did not follow the manufacturer’s instructions for the malfunction. For details, see [13].
Roll oscillations during approach, based on [14]
In 1994, Dragonair Flight HDA323, was on approach to Hong Kong international airport in gusty weather. The aircraft was an A320. During the first IGS approach to runway 13 with the flaps in “config full”, the aircraft encountered a severe gust, that caused a small temporary flap displacement, enough to engage the “flap locking” mechanism. (A system that prevents asymmetric deployment of the flaps). When the system engages, the flaps are locked in position and cannot be moved again during flight. The captain decided to go-around and position for another approach. During the go-around, the flap lever was moved to position 3, in accordance with SOP’s. The aircraft experienced a series of roll-oscillations. During the subsequent approaches, the aircraft also encountered significant roll-oscillations, as depicted in Figure 6.
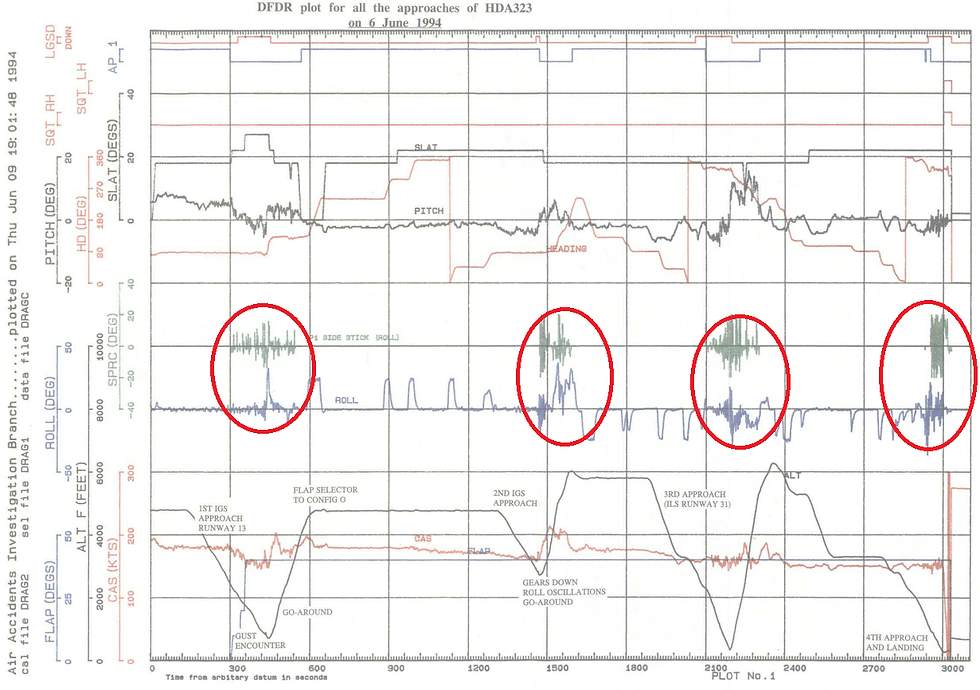
The above FDR plot shows the 4 (!) consecutive approaches (2 IGS 13 and 2 ILS 31) at Hong Kong International airport. Clearly, the roll-oscillations (red circles) begin whenever the captain tries to manually control the aircraft. As the flaps were locked, only the slats moved when the crew re-positioned the flap lever.
Critical: The crew were directed by the Electronic Centralized Aircraft Monitor (ECAM) to move the flap lever to “config 3”, one step less than “config full”. HOWEVER: There was an active Operational Engineering Bulletin (OEB) from the manufacturer, that required the flap lever to be maintained in “config full”, if the flaps were locked in “config full”. The crew was not aware of that OEB. Unbeknownst to the crew, the roll-kinematics of the aircraft were significantly different, when the flap lever was moved to “config 3”.
Background: The A320 employs a FBW system where roll-control is achieved using a “rate-command”. I.e., the lateral stick-deflection orders a specific roll-rate, with a maximum of 15 °/s in “normal law”. It is essential that the flight crew comprehends the implications of this, namely that much less “stick inputs” are required compared to a “conventional” airplane and that a “free stick” simply demands 0 °/s roll-rate (for bank angles less than 33°).
The roll-rate demand was the same for “config 3” and “config full”. However, the roll-acceleration was NOT. The aircraft was much more sensitive when the flap lever was in “config 3”. The crew did not know that and massively “overcontrolled” in the roll-axis during every approach, even on the first one, where the flap lever was in “config full”. The reason they landed on the 4th approach, was simply that they were running out of fuel. The aircraft manufacturer later carried out simulations to investigate the behavior of the aircraft in that specific condition. The results showed that the aircraft would have been controllable, although it was somewhat sensitive to APC due to the roll-kinematics. This was probably the most severe of a series of similar events involving A320 aircraft in “config 3“. Several roll-oscillations were encountered by different operators and the manufacturer later changed the roll-characteristics to be less susceptible to APC in “config 3” with a simple software upgrade. Looking at Figure 6, it is quite obvious that a simple “let go the controls” would have stopped the roll-oscillations, as the aircraft was perfectly stable when the autopilot was engaged between the approaches. The report makes no mention of an attempted automatic landing. This is a very illustrative example of an aircraft changing “behavior” and the crew not being aware of it. The massive amount of “stick-reversals” should have alerted the crew as to potential APC.
Summary
So, what to take away from all this? If we boil it down to the essential, we can constitute the following:
1. No pilot or aircraft is immune to APC.
2. As pilots, we shall be “on guard” to recognize APC. Some hints are listed below:
- High precision task? (approach, landing, formation flight etc.)
- Change in aircraft characteristics (stick-forces, control law)
- Trigger event (turbulence, AP disconnect)
- Several consecutive inceptor reversals?
3. Best chances to stop APC: Exit the loop. Let go or “freeze” the controls, if conditions permit.
4. If an un-resolved flight control issue exists: Keep/switch ON the fasten seatbelt sign.
Revision/20210119
References
[1] Committee on the Effects of Aircraft-Pilot Coupling on Flight Safety, National Research Council, Aviation Safety and Pilot Control: Understanding and Preventing Unfavorable Pilot-Vehicle Interactions, National Academy Press Washington, 1997, DOI 10.17226/5469
[2] Vepa, Flight Dynamics, Simulation, and Control for Rigid and Flexible Aircraft, CRC Press, 2015
[3] NATO RTO TECHNICAL REPORT 29, Flight Control Design – Best Practices, NATO RTO, 2000
[4] Bicakci & Albostan, Evaluation of Nonlinear Elements Effects on Aircraft Pilot
Coupling for Highly Maneuverable Aircraft, 8TH EUROPEAN CONFERENCE FOR AERONAUTICS AND SPACE SCIENCES (EUCASS), 2019, DOI: 10.13009/EUCASS2019-590
[5] Pratt, Flight control systems, AIAA, 2000
[6] Abzug & Larrabee, Airplane Stability and Control, 2nd edition, 2005
[7] Duda, Flight control system design considering rate saturation, Aerospace Science and Technology, no 4, 265-275, Elsevier, 1998
[8] Ossmann, Heller, Brieger, Enhancement of the Nonlinear OLOP-PIO-Criterion
Regarding Phase-Compensated Rate Limiters, AIAA Atmospheric Flight Mechanics Conference and Exhibition, Honolulu, Hawaii, 2008
[9] NTSB, Flight test data recorder factual report N525TA, 2017
[10] NASA, Pilot-Induced Oscillation Research: Status at the End of the Century, Dryden Flight research center, 2001
[11] Lawton, Inadvertent inflight slat deployment on MD-11 results in two fatalities, 156 injuries, Flight Safety Foundation, 1994
[12] Finnish Safety Investigation Authority, In-flight Upset of a Business Jet in the Moscow Terminal Control Area on 23 December 2010, Investigation Report C12/2010L, 2013
[13] ROMANIA MINISTRY OF TRANSPORT CIVIL AVIATION INSPECTORATE, FINAL REPORT on the ACCIDENT of the FALCON 900B registered SX-ECH, Nr. 711, 2000
[14] Civil Aviation Department Hong Kong, Report on the Incident to Airbus A320-231 VR-HYU at Hong Kong International Airport on 6 June 1994, 1997


