The physics of high-altitude glideslope intercepts and approach procedures in mountainous terrain
- Andreas
- Jan 9
- 7 min read

Updated: Jan 10
Same same but different, would probably be an adequate description when comparing a final approach beginning at 3000 ft vs. one at 10’000 ft. There are differences, some more obvious than others. Without proper preparation, chances are you will get a surprise introduction. This article will summarize some key points for long and high final approaches.

TAS and turn radii
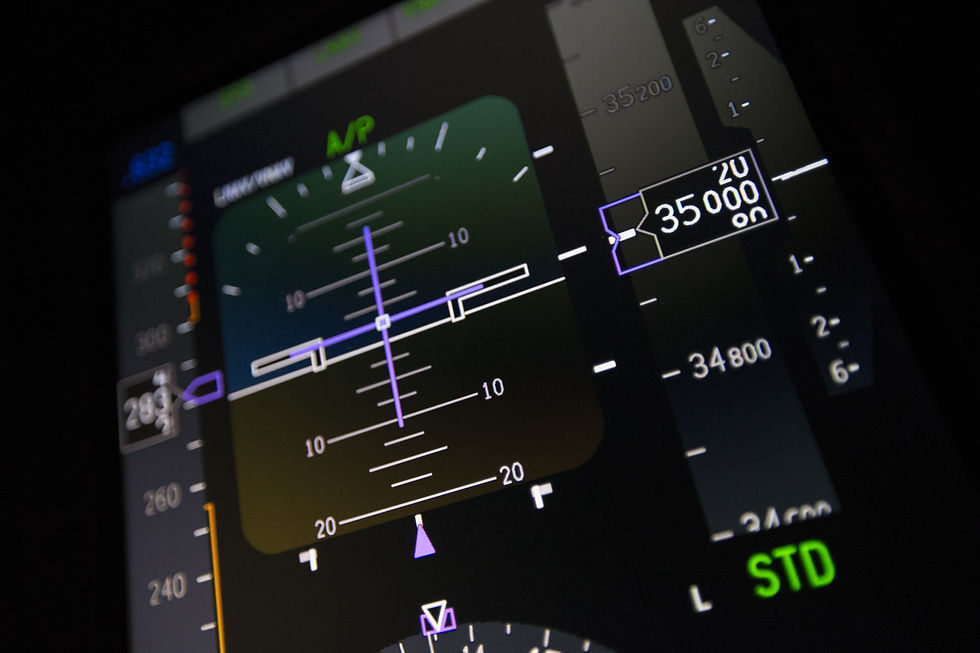
For starters, let us deal with the obvious problem of high True Airspeed (TAS). It will be clear to the audience, that for a given indicated airspeed (IAS), TAS will increase with altitude. The interested reader is referred to this article for details. Every pilot will remember the rule of thumb of 2% per 1000 ft. In other words, at 10`000 ft we can expect a 20% difference between IAS and TAS. Does not sound like much? Time to investigate two important concepts:
How does the turn radius of a horizontal turn change as a function of TAS? Luckily, there is a handy formula for this [1]:

The message of the above formula:
Turn radius increases proportional to the square of TAS.
A similar picture emerges when we look at the radius of a pull-up / push-over with a constant load factor [2]:

The message here:
Pull-up / push-over radius increases proportional to the square of TAS.
With:
r = radius in m
v = TAS in m/s
ᵠ = bank angle in °
g = gravity in m/s2
n = load factor
It will be clear that any comparison of turn radius to the ground will have to consider groundspeed (GS), but the message will essentially be the same.
As can be seen above, doubling the TAS for a given load factor, will quadruple the curvature radius. That brings us to one of the most important considerations for high-altitude intercepts:
Plan ahead and slow down.
While the capture of the approach course may become problematic at high TAS (reaching the bank limit), the glideslope-intercept can have its own challenges. As evident from the formula above, its curvature causes a significantly larger change in load factor (delta nz) if flown at a higher TAS. While most guidance computers have “inner loops” limiting delta nz, this can still surprise the flight crew with an associated temporary drag reduction (due to low nz). This brings us to the next important point:
Avoid being close to Vfe during glide intercept.
While the “usual” glideslope-intercept speed (IAS) might be fine at 3000 ft, this does not imply it will be “ok” at 10`000 ft. For those who worry about slowing down a couple of knots early, try calculating the difference in time of arrival at the runway. The result will be expressed in seconds…
Temperature effects
The well-known temperature error of a barometric altimeter increases with increasing height above the baro-setting-source. It is therefore self-explanatory that special care should be taken when operating at such airports in low-temperature conditions, as one of the primary reasons for a long final segment are high mountains. Note also, that the indicated baro-V/S will be incorrect at non-ISA temperatures, a point well-worth briefing.

Usually, the operator will provide detailed guidance for flight crews on how and when temperature correction should be applied. One aspect not to be overlooked is the OEI-take-off flight path. Especially if the 2nd segment is extended and the OEI-acceleration altitude is rather high, the correction for cold temperature becomes important, as indicated above.
Some performance applications correct for non-ISA temperatures when showing acceleration altitudes, others do not. Know your system!
Caution with high temperatures during approach
Temperatures above ISA are usually not corrected for, as obstacle clearance is not an issue. However, as evident from the Figure above, higher-than-ISA temperatures will cause a steeper flight path angle when using barometric guidance. This can cause an energy (deceleration) problem for heavy jet aircraft.
Increased obstacle clearance in mountainous areas
ICAO PANS-OPS vol. II [3] stipulates, that the Minimum Obstacle Clearance (MOC) used by procedure designers should be increased by as much as 100 % to account for the effects of wind-induced altimeter errors and flight path deviations due to turbulence in mountainous areas. Even if flight crews are not usually involved in procedure design, it is certainly good practice to have an idea of the magnitude of these effects.
Altimeter error due to mountain waves
There is very little data regarding this effect, and many sources cite a famous study conducted years ago for Alta airport (ENAT), Norway [4]. While specific to an area of interest in Norway, this work provided some estimates of the error induced in a barometric altimeter due to wind masses being accelerated over mountain ridges. These values can now be found in PANS-OPS vol. III [5] and have been augmented with a curve-fitting by [6], resulting in the Figure below:
![Figure 3: Estimated altimeter error due to wind in mountainous areas [6] (CC-BY 4.0)](https://static.wixstatic.com/media/43d115_84c393290fe5425b862de74e92073b9d~mv2.png/v1/fill/w_902,h_566,al_c,q_90,enc_avif,quality_auto/43d115_84c393290fe5425b862de74e92073b9d~mv2.png)
Altitude deviation due to turbulence
Similarly, air masses moving across mountains can induce turbulence, which in turn causes flight path deviations. The Figures below are based on a real-world scenario at Pico Island (Azores) [7]. The south-westerly winds create significant mountain-waves when flowing across the ridgeline. The magenta line shows the relevant cross-section of Figure 5 below. Colours represent vertical wind velocity in ft/min. Wind barbs show true wind (north-up).
![Figure 4: Top view of Pico Island (Azores), based on a real-world scenario. Colours represent vertical wind velocity in ft/min. [7] (CC-BY 4.0)](https://static.wixstatic.com/media/43d115_f042397ad65649d985fbb718422737f0~mv2.png/v1/fill/w_921,h_612,al_c,q_90,enc_avif,quality_auto/43d115_f042397ad65649d985fbb718422737f0~mv2.png)
Even with relatively benign wind velocities, significant vertical air movements can be observed. Meteorologists use a parameter called “Froude number” (Fr) to describe the relation between kinetic and potential energies in an orographic flow [7]. This dimensionless number helps to determine if a mountain wave is likely to form. The interested reader is referred to [7].
![Figure 5: Cross-section of Pico Island, as indicated above. Colours represent vertical wind velocity in ft/min. [7] (CC-BY 4.0)](https://static.wixstatic.com/media/43d115_dfedae0acec0446287fd4bbbf0cd8e1a~mv2.png/v1/fill/w_756,h_595,al_c,q_90,enc_avif,quality_auto/43d115_dfedae0acec0446287fd4bbbf0cd8e1a~mv2.png)
The resulting altitude deviation will strongly depend on the category of aircraft, its speed and wing-loading and for prolonged exposure on its performance reserves.
The workflow below has been developed by Perez Sanz et al. [6] in order to establish a more accurate estimation of the additional obstacle clearance needed in mountainous terrain. Vertical gust velocities are derived from horizontal wind speed. These are then converted into load factor variations and ultimately transformed into flight path deviation based on exposure time and TAS. The altimeter error is based on the fitted curve from PANS-OPS [5].
![Figure 6: Typical procedure-design workflow to account for wind- and turbulence-induced errors in mountainous areas [6] (CC-BY 4.0)](https://static.wixstatic.com/media/43d115_c47ec4ef7f744b47b1e26c44fbff99f3~mv2.png/v1/fill/w_980,h_978,al_c,q_90,usm_0.66_1.00_0.01,enc_avif,quality_auto/43d115_c47ec4ef7f744b47b1e26c44fbff99f3~mv2.png)
Bear in mind that the hard work of establishing procedural altitudes following the workflow above is left to the procedure designers, yet we as pilots may very well experience the physical consequences of flying in high-wind conditions near mountainous terrain.
Earth curvature
“And now for something completely different” [8]: The curvature of the Earth. A little bit of history: A nautical mile (NM) was originally defined to be 1/60th of a degree of latitude along a meridian [9] (surely the oldest reference on this website). It was later changed in 1929 to correspond to 1852 m [10]. The historic definition still provides us with an intuitive concept: If we move 60 NM along a meridian, the latitude will have changed by 1° or in other words, the Earth will have curved by 1°. What does that have to do with an ILS glideslope? Well, we shall look at the Figure below:

Although exaggerated, the Figure above makes an important point: Strictly speaking, the ILS glideslope angle is valid at the threshold only. The further away we move, the “steeper” it appears for an observer comparing it to the local horizon. (This is true for any geometric approach path). The effect if usually without significant consequences, since the final approach segment length is limited. However, this poses an interesting question: How does this compare to a constant barometric flight path angle (baro-FPA)?

That should convey the message, that when following a geometric path like an ILS glideslope at constant groundspeed, we should “see” an ever slightly decreasing V/S. If you have difficulty imagining this, try to think how a line of constant altitude would look like in the above Figure. It would be a line which is concentric with the Earth’s surface and the blue line (constant baro-FPA) would cross it at a constant angle. This produces a discrepancy between geometric path and constant baro-FPA over large distances. This effect is usually ignored by the profile-view of the approach chart due to its limited magnitude. Indeed, some Air Navigation Service Providers (ANSP`s) and chart providers specifically state, that they are ignoring the curvature of the Earth [11] [12].
An example of this can be found as a note regarding the differences between “check altitudes” and the advisory glideslope on the LOC DME East 26 approach in Innsbruck (LOWI) [11] (Yes, this is a LOC approach with an advisory glideslope). For reference, the intermediate approach altitude there is 9`500 ft and the final segment about 19 NM long.
And indeed, after some number-crunching we can estimate this for a 3°-glideslope (approximation):

As evident from Table 1, the effect only manifests itself on a very long final approach. It is however noteworthy, that a 3°-ILS-glideslope at the threshold will appear to be around 3.3° at 20 NM from the threshold. This also explains why it can be difficult to slow down while following the glideslope during that portion of the approach.
The message to remember:
A geometric glideslope appears steeper with increasing distance from the threshold. The effect is rather small, and therefore often glossed over.
Workload management
Many SOPs include some form of workflow passing flight level 100 in descent. If that is very close to or even below the intermediate approach altitude, this can result in a high-workload scenario. It can be very useful to brief this aspect and mitigate it by adjusting the workflow as permitted by the operator.
References
[1] | P. J. Swatton, The principles of flight for pilots, Wiley, 2011. |
[2] | T. R. Yechout, Introduction to flight mechanics, Virginia: AIAA, 2003. |
[3] | ICAO, «PANS-OPS, vol. II, Construction of visual and instrument flight procedures, 7th edition,» 2020. |
[4] | A. RASHEED und A. MUSHTAQ, «Numerical Analysis of flight conditions at the Alta airport, Norway,» AVIATION, Bd. 18, Nr. 3, pp. 109-119, 2014. |
[5] | ICAO, «PANS-OPS, vol. III, Aircraft operating procedures, 1st edition,» 2018. |
[6] | L. Pérez Sanz , A. Fernández-Shaw González, J. Pérez-Castán, L. Serrano-Mira , D. Rodríguez Fernández und E. Sánchez Ayra, «Additional Clearance over Obstacles to Determine Minimum Flight Altitude in Mountainous Terrain,» Applied sciences, Bd. 14, Nr. 5155, 2024. |
[7] | J. Maruhashi, P. Serrão und M. Belo-Pereira, «Analysis of Mountain Wave Effects on a Hard Landing Incident in Pico Aerodrome Using the AROME Model and Airborne Observations,» Atmosphere, Bd. 10, Nr. 350, 2019. |
[8] | And now for something completely different. [Film]. Monty Python, 1971. |
[9] | N. Germanus, «Ptolemy's Geography,» 1482. |
[10] | Britannica, «Britannica,» 15 12 2025. [Online]. Available: https://www.britannica.com/science/nautical-mile. |
[11] | Austro Control, «AIP Austria, LOWI AD 2-1,» 2025. |
[12] | Jeppesen, «Gradient to rate table,» 1989. |